Counting Books
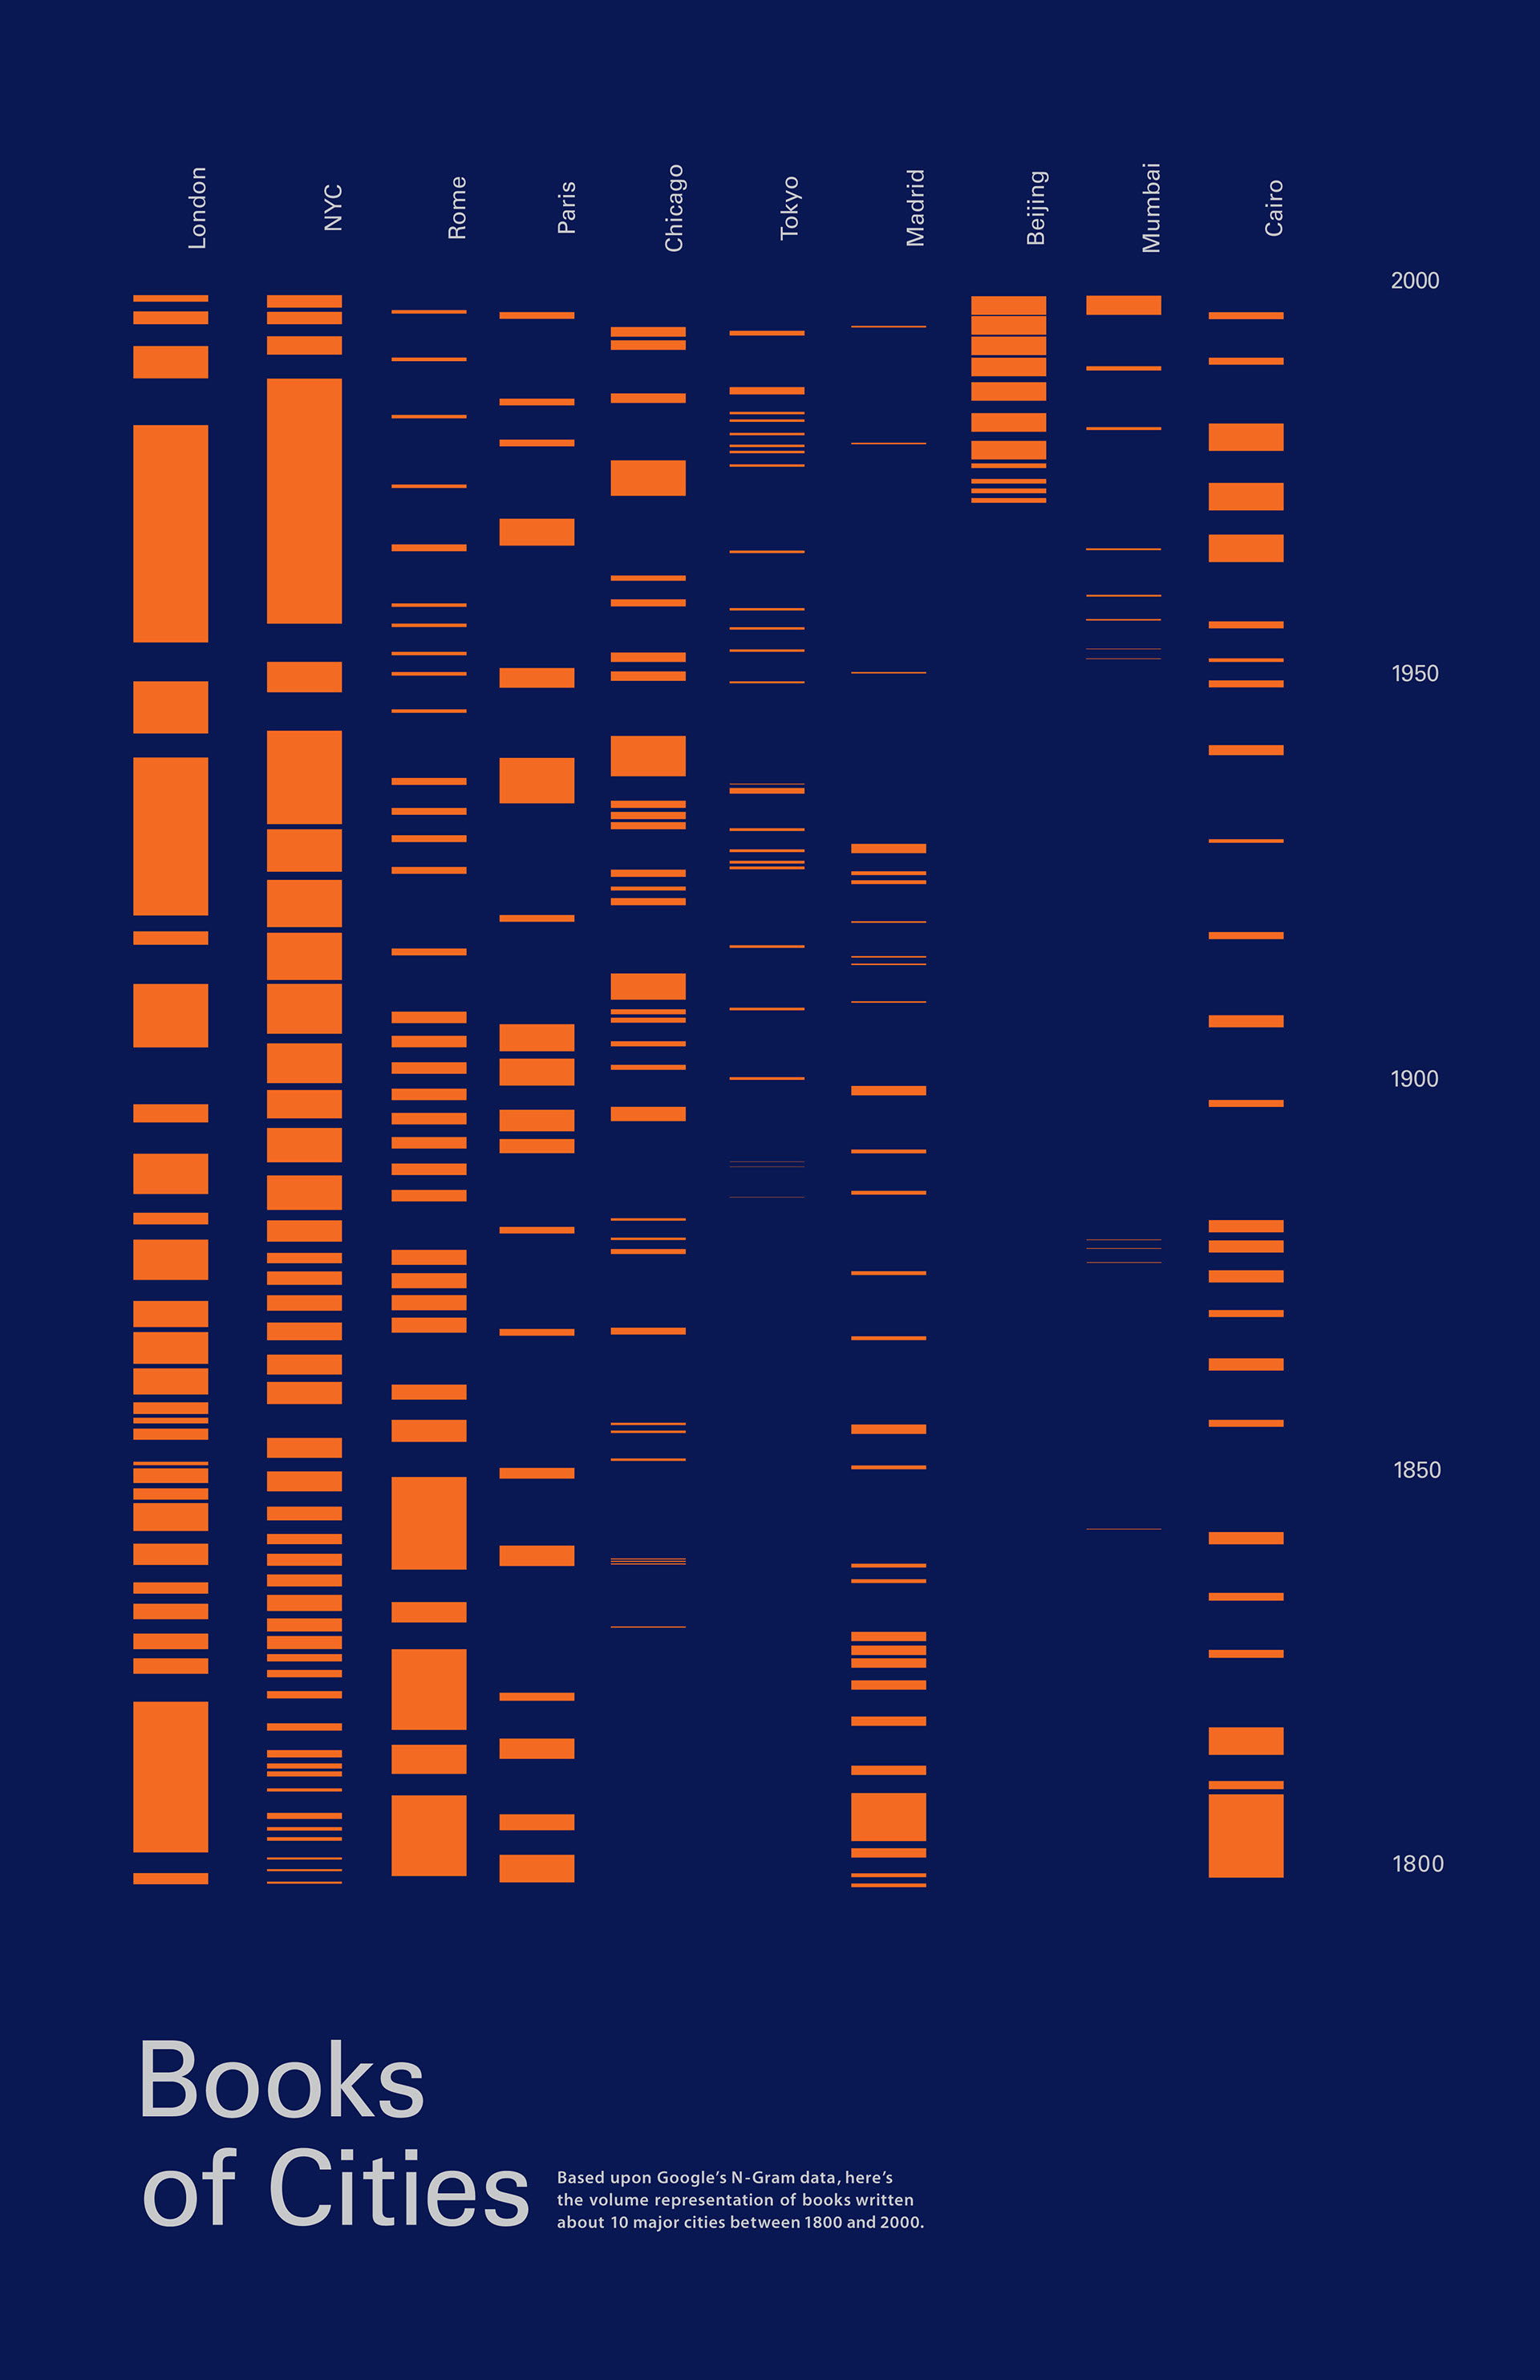
A stylish visualization has been making its way around the internet this week: Edgard Barbarosa mined Google’s N-Gram viewer to visualize which cities are most name-dropped in novels over the last two centuries. You’ll notice that this is actually the result of a school project assigned by Professor Jeane Cooper of Florida Atlantic University for a graphic design course. It makes me wonder if asking students to design visualizations of art history like this might actually make for a productive term assignment?

