Networks of the Smithsonian American Art Museum
This summer I developed a small utility to scrape collections data from the Smithsonian Institution’s database. I got to work digging through the artworks at the Smithsonian American Art Museum. Using Gephi I created a network map of artworks there made between 1900 and 1935. (You can click through to go to an interactive version.) I’ve posted the scripts used to create this on GitHub.
So what is this showing? From a list of 40,218 artworks in the Smithsonian American Art Museum, I generated a subset of 19,584 records that have both a date as well as assigned keywords. From this subset I created a yet smaller subset database of those artworks whose date fell between 1900 and 1935, resulting in 2,255 records.
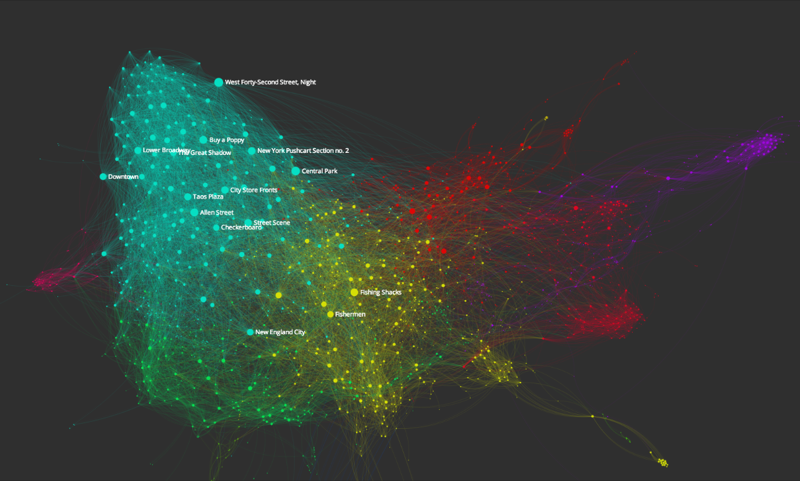
In this visualization, every node, or point on the graph, represents a single artwork record. The computer has drawn an edge, or connection, between artworks when those two artworks share 5 or more keyword tags (Adding this cutoff ensures that the links between artworks have a certain level of meaning – that they share more than simply a format, like “painting” or “drawing”.) These nodes and edges have been positioned by an algorithm that pushes apart nodes that do not share connections, and pulls together nodes that do share connections. The size of each node increases the more artworks with which they share an edge.
The color has been assigned by an algorithm that attempts to detect “communities” of nodes; i.e. groups of nodes that are relatively more connected to each other than they are to the rest of the network. This algorithm does not understand the meaning of topic keywords or titles – it works only by judging the relative number of connections between the many nodes in this network. This feature of the graph visualization is especially helpful for understanding, at a glance, the broad thematic outlines of American art of this period:
- A large portion of the network comprises city views, though these are distributed into smaller neighborhoods for those artists portraying New York, Chicago, or European cities.
- Interweaved with these urban images are images of rural/regional labor (“American Scene” art promoted by federally-funded art programs of the New Deal).
- These in turn intersect with a number of smaller groups, such as WWI-related art, scenes of domestic life, and even a group of self-portrait/artist-at-work images – groupings that might not so quickly come to mind in conventional discussions of American art from this period.
What might these communities look like for the period of 1865-1900? Or 1935-1965?
Even the more idiosyncratic portions of this network are telling, at least about the vagaries of the SAAM collections or of my own analytical method. Some clusters in this network, like the tightly-interconnected blue island only tenuously connected to the rest of the graph, represent not some multi-artist genre or movement of art, but stand only for a series of related works by a single artist – in this case, a long series of progressive print proofs by Chiura Obata.
This island poses several interesting problems:
- Should we count a series of related works (particularly in multiplicative media like prints or photography) the same way that we count paintings or sculptures? The appearance of this “island” of works by Obata reminds us we ought not read this graph directly as an indication of the relative popularity of artwork subjects.
- The insularity of Obata’s prints begs the question: was the subject matter of his prints really so isolated from other trends? Or is their isolation magnified by cataloging practice that assigns the same keywords to the entire group of prints, tightly connecting them in our graph while possibly neglecting other links that would draw the prints closer to the rest of our sample?
These problems cut to the core of not only art historical narratives about genre and media, but also force museum professionals to reconsider how they are generating cultural data in their cataloging practices.
