A Radical, Useable Data Model
Attendees of Keystone DH were just treated to a fantastic keynote address by Miriam Posner.
I find myself both chastened and enlivened by her call for a DH that embraces difficult subjects around race, gender, and sexuality (among many others) not only by taking them as research subjects, but by developing de-centering, weird-making data models models that resist categorical ontologies.
Of all her examples, I was most struck by the idea of how to model highly contingent and contextual properties of our lived experience. To offer an ever-extending list of possible values (Miriam pointed to the voluminous Facebook gender selection field) avoids the fact that these aren’t atomic attributes bound to a person’s existence. As we all know, these attributes are constructed entirely from social context; they only become sensible when viewed from a particular perspective seated in personal identity, in time, and in space/place.
As part of the talk, Miriam wondered whether existing tools and models can be repurposed to suit these kinds of radical data models, or whether we need to fundamentally rewrite them. I don’t have a definitive answer for this, but I would like to walk through a bit of a thought experiment in this post: what if we could build some semblance of this kind of model in an RDF database, the kind that powers Linked Open Data?1 This has been on my mind as I’ve been working through revising my practical lesson for humanists on how to use SPARQL, the query language for graph databases. (I won’t be doing a full intro to RDF/graph databases here, so you may want to read through that lesson first if these concepts are entirley new to you.)
Radical RDF
In her talk, Miriam gave an example of a neighborhood whose race might be constructed very differently depending on one’s perspective. A simplistic classification of neighborhoods that allows only one value might characterize “Springfield” as “majority African-American”, which in RDF syntax would read like this:
<Springfield> <has_race> <African-American> .
If visualized like a graph, this statement looks like so:

A hopelessly simplistic model of race.
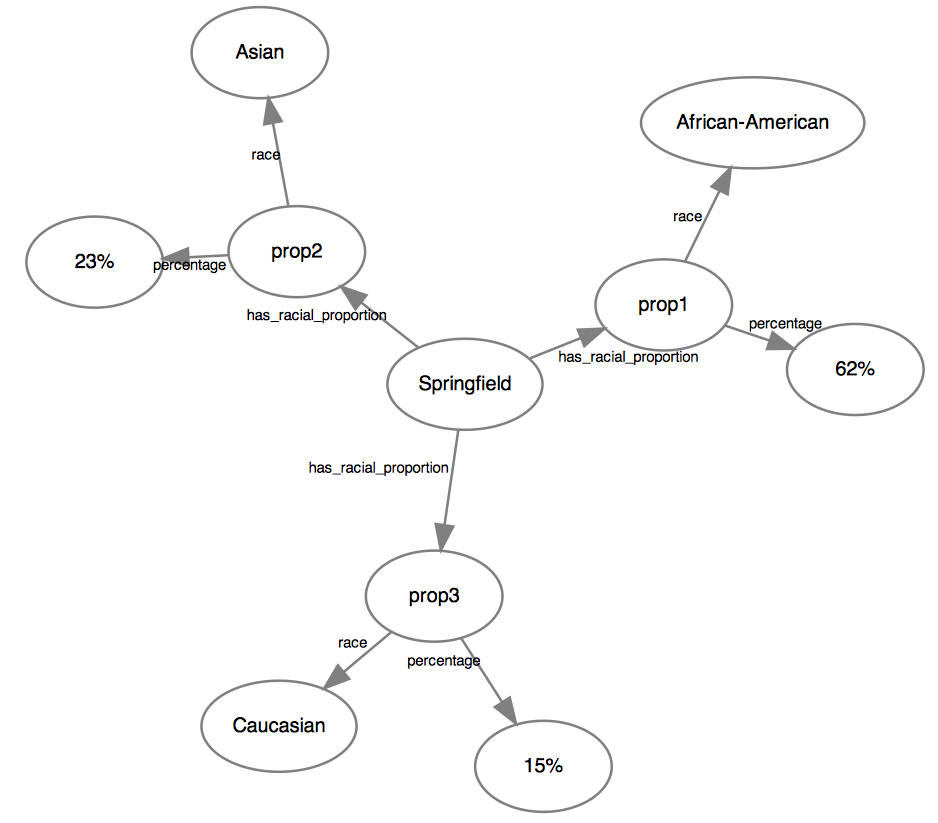
This is clearly insufficient. An easy quantitative model might be to list the different proportions of populations within the neighborhood:

Ok. Ratios.
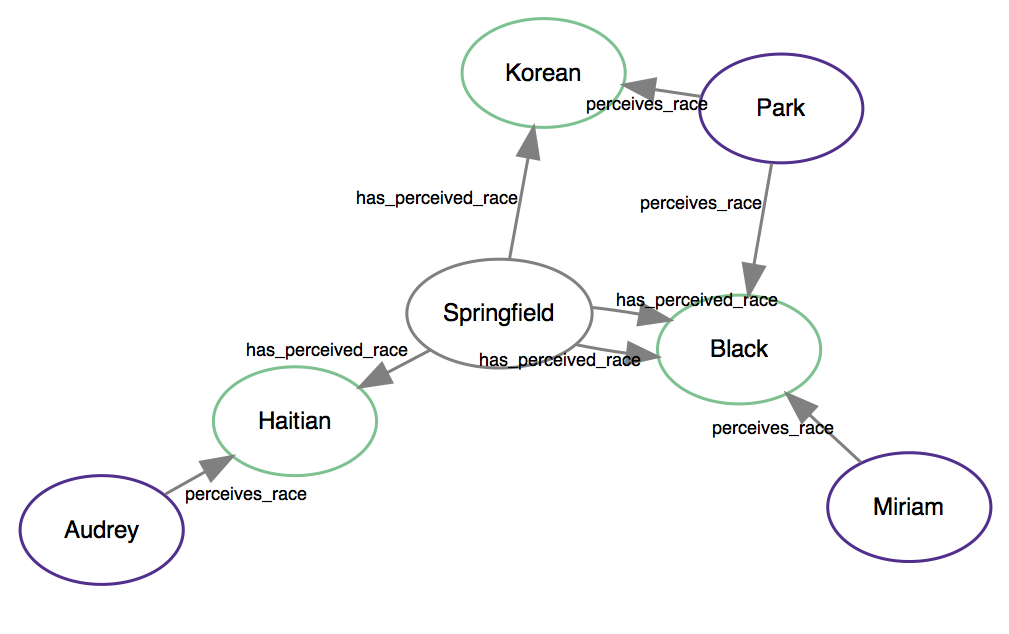
but this does nothing to address the fact that race is socially constructed. As Miriam suggested, she might readily identify the neighborhood “black”, but another person may instead instead understand it as “Haitian”. This kind of multi-dimensional relationship is exactly what RDF databases are designed for:

A model of race that tries to account for its social construction.
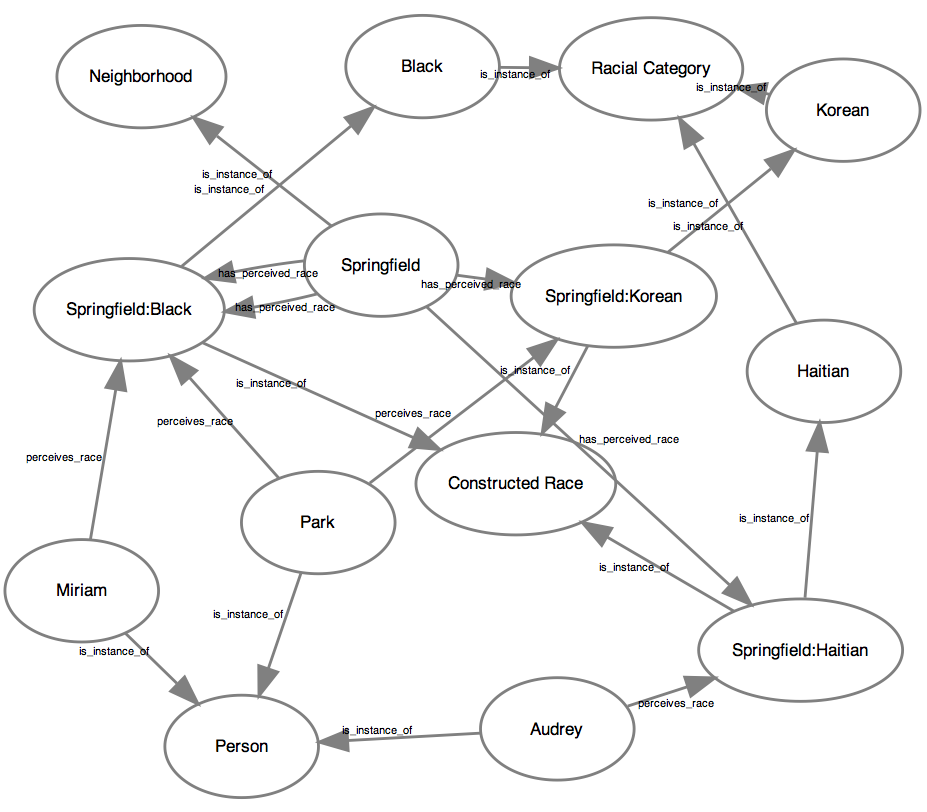
Here, perceived race sits in an intermediate position between the neighborhood and the subject. Now, the database would need to include even more attributes, such as the types of each node:

A model with even more attributes.
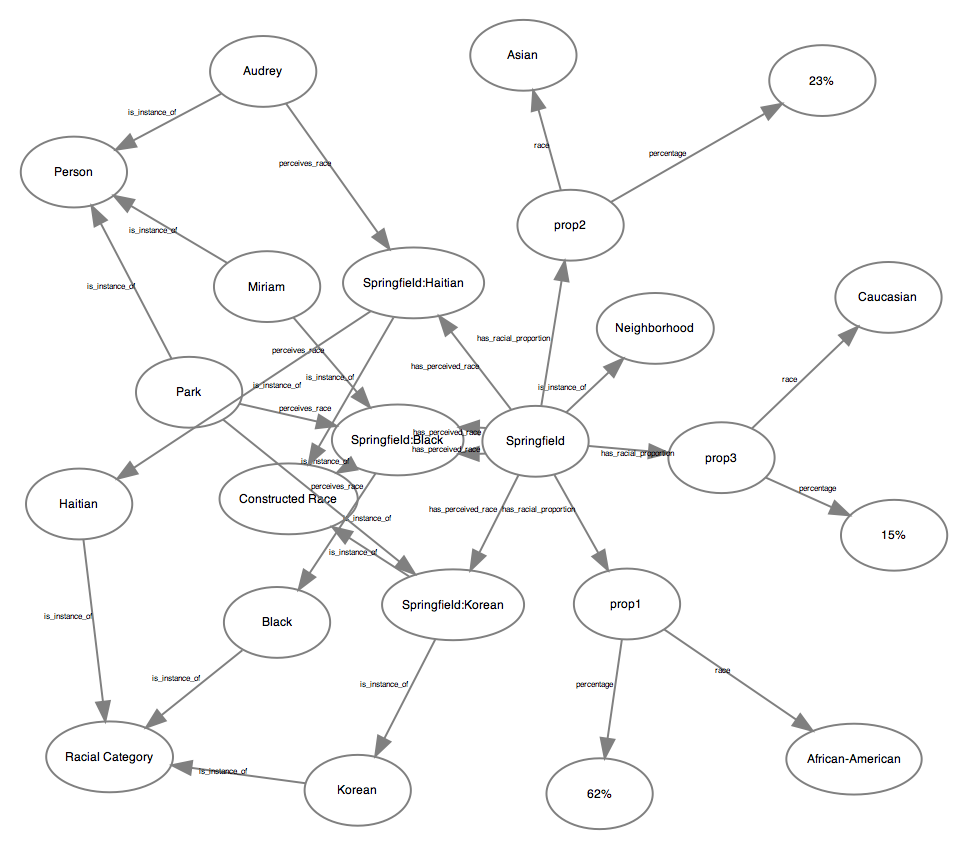
Perhaps one of the greatest strengths of the RDF database is the ability for multiple layers (even contradictory ones) to coexist within the same store. That census-like information about population ratios? It can live alongside our more contextual model for perceived race.

All these models we have? They can live together in the same database.
But is is usable?
Why do all this? For one, we now get multiple answers to the the question “What are the perceived race(s) of the neighborhood Springfield?”2:
SELECT ?race
WHERE {
  <Springfield> has_perceived_race ?race .
}
gives us the following answers:
| race |
|---|
| Black |
| Haitian |
| Korean |
But more than that, we can now ask the kinds of questions that didn’t quite make sense before. Imagining that we had multiple neighborhoods within our dataset, we might compare to what extent the racial construction of each neighborhood is contested:
# For each neighborhood in our data, we will count the
# pairings of people who perceive its race in distinct ways

SELECT ?neighborhood (COUNT(?pairing) as ?n_contest)
WHERE {
  # Look for nodes in the graph that are neighborhoods
  ?neighborhood has_type <Neighborhood> .

  # Find any two combinations of "perceived race" for those
  # neighborhoods

  ?neighborhood has_perceived_race ?perceived_race1 .
  ?neighborhood has_perceived_race ?perceived_race2 .

  # Find the combinations of people who perceive each of these
  # distinct categories

  ?person1 has_type <Person> .
  ?person2 has_type <Person> .
  ?person1 perceives_race ?perceived_race1 .
  ?person2 perceives_race ?perceived_race2 .

  # Only keep the pairs of people who perceive the neighborhood's
  # race differently

  FILTER (?perceived_race1 != ?perceived_race2)

  # Create a new variable containing this pairing of people

  BIND(CONCAT(?person1, ?person2) AS ?pairing)
}

# Group all the pairings by neighborhood
GROUP BY ?neighborhood
| neighborhood | n_contest |
|---|---|
| Springfield | 3 |
| … | … |
This might be a useful way to think about contested identity; it might be a terrible one. Either way, such a computational experiment might spur us to further unpack what we mean by “particularly”, not to mention “contested”. By using an RDF database, however, it becomes much easier to layer multiple models of race on top of one other, querying them against each other and affording a whole range of perspectives at the same time, rather than choosing one to enforce at the level of the database.
It is probably possible to extend this basic model to factor in time and space,
as Miriam suggested (though I’m not quite sure how to implement that off the top
of my head.) Moreover, we might even design a query that has an element of
chance (probably involving some clever use of RAND() or SAMPLE()), such that
running it on the same data might return a different response each time — a
highly suggestive engineering decision.
If this seems like a terribly complex database and query method, that’s because it is. In her keynote, Miriam alluded to the tension in DH between the desire for elegant user interfaces and visualizations that make arguments as clearly and lucidly as possible, and the desire for highly complex data models and representations. Without minimizing the excellent work done by UX designers in helping to streamline complexity, we also need to acknowledge that, at a certain point, we cannot have our cake and eat it too. I agree with Miriam that there is a logic in advocating for difficult data, interfaces, and visualization when the object of study is truly difficult to get your hands around. Requiring users to spend a great deal of time and attention to understand and use our database might be just the kind of radical act we need.
Edit: Deb Verhoven brought my attention to a very relevant paper she has authored on interlinking viewpoints within databases: Deb Verhoven, “Doing the Sheep Good: Facilitating Engagement in Digital Humanities and Creative Arts Research,” in Advancing Digital Humanities, ed. Paul Longley Arthur and Katherine Bode (London: Palgrave Macmillan, 2014), 206–20, http://www.palgraveconnect.com/doifinder/10.1057/9781137337016. (Available on Academia.edu)
-
I’d be quite shocked if I were the first person to think of this. If I’ve been remiss in finding other precedents, please let me know in the comments. ↩
-
Much like the graphs I’ve shown here, the following are pseudo-SPARQL queries, so they’re lacking the usual baggage of prefixes and URIs. Again, take a look at my SPARQL tutorial to get a rundown on what is going on here. ↩
