Charting the Rijksmuseum: Iconclass
In my previous post I mentioned briefly the idiosyncratic iconography notation schema Iconclass. I’ve been familiarizing myself with the system over the summer in order to figure out how to tackle the great trove of artistic data made available by the Rijksmuseum via their API (a computer-friendly way to access their collections data, in layman’s terms). In their own words, they invite users to “use objects in their entirety, combine collections, combine our data with other sources, and to sample and quote.”
Over the next week I will be publishing a series of posts summarizing my very initial exploration of these data, with some reflections on future work as well as potential implications for art historical study and the creation and dissemination of cultural data.
Iconclass
The art historian Henri van de Waal began to develop Iconclass in the early 1950s to provide “a systematic overview of subjects, themes, and motifs in Western art,” with a particular emphasis on systematic. An Iconclass notation comprises a string of digits and characters (with possible additional tags or attributes) meant to accurately and authoritatively classify iconography in European art.
Reviewing the early publication of the Iconclass index in 1977,1 Jochen Becker prophetically prescribes a way to address the shortcomings of its print version:
Laborious linear sifting of the literature, transcribing the information on index cards and ultimately publishing the result in book form should give way to computer processing, which would lend much broader scope to documenting both the literature and the pictorial material itself. The resulting bibliography would remain “open” and up-to-date, give access to all the literature encompassed – and to artists’ names, technical data, indeed, everything fed into the program. Print-outs could be made available at any time, both the complete store and any special subject desired.
This computerization would come to pass under the auspices of the Rijksbureau voor Kunsthistorische Documentatie in the late 2000s, with several institutions such as the Rijksmuseum classifying their collections using the scheme and using it to aid in searching their works. Even in his review thirty years earlier, Becker predicts the benefits of such computerization:
Most importantly, questions and answers would no longer have to be linear. Let us take as an example a question about “broken jugs” (
33C4211) – what has been written on this theme? Alternatively, the question might be where the theme of the “broken jug” may be found depicted, as well as where it occurs in primary and secondary sources. … If there were an appropriate computer program and store, the question could be much more specific – where would one find “broken jugs” in 18th century French art, and are there any reference? What about the 17th-century Netherlands? Does the “broken” jug theme occur in pottery? In the school of Rembrandt?
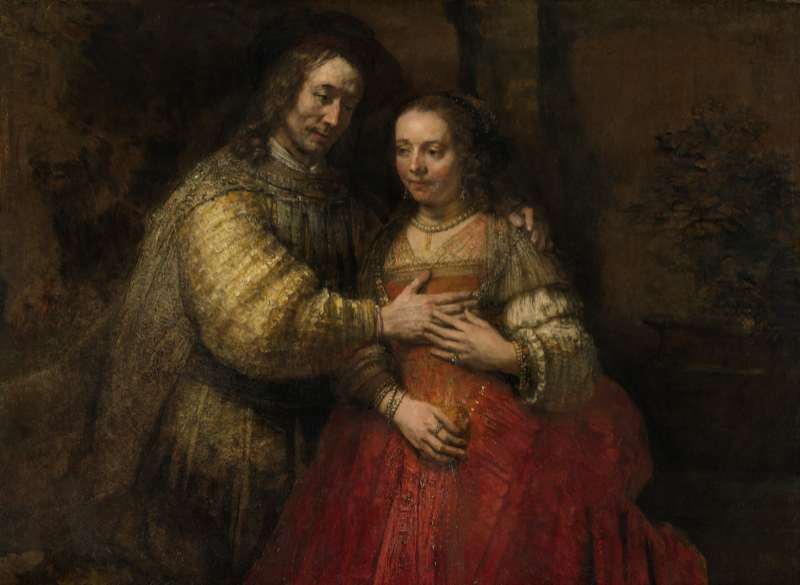
Iconclass is specifically structured to allow the search and retrieval of visual images. Its syntax is hierarchical: each successive character in a notation reduces the scope of the description. For example, the notation 71C217 (which is used on this work from the Rijksmuseum collections) describes, in increasing specificity:
- 7 – Bible
- 71 – Old Testament
- 71C – Genesis: the patriarchs
- 71C2 – story of Isaac
- 71C21 – Rebekah (Rebecca) sought in marriage (Genesis 24)
- 71C217 – marriage of Isaac and Rebekah
This built-in hierarchy allows a kind of “fuzzy search” for related images. From an image of Isaac and Rebekah, I could also find images of other Genesis stories, or of the Old Testament even more generally, or of the Bible more generally still.
While Becker’s questions remain important, they can essentially be resolved by performing individual lookups on an image database categorized according to Iconclass. While this process may certainly be aided by computers, it is nothing that a persistent scholar couldn’t do with printed indexes and a good pencil and notebook (not to mention hermetic focus and patience.) Yet the contributions of computerized records and indexes need not be limited to speeding regular queries. They offer entirely new paradigms for using this data.
In the past year, the Rijksmusem in Amsterdam has opened not only their images, but all the associated data of more than 100,000 objects from their collection, for open download and manipulation. This publication of a vast trove of structured, computer-readable information allows us to ask questions that Becker did not consider in the 70s. We have the capacity to do large-scale analysis of all of this data at once. By essentially counting paintings, rather than trying to look closely at each and every one them, can we visualize decades- or centuries-long trends in art history?
This was a question I’ve been grappling with this entire summer, and I’ve got some preliminary thoughts to share.
Charting the Rijksmuseum
After downloading the Rijksmuseum data using their API, I tidied it up somewhat, discarding records that were missing either a date or an Iconclass notation. About three quarters of their objects have both these fields, providing a robust sample of a little over 75,000 records to query.
A starter question was this: from what years does the Rijksmusem have the most art? Going through the database year by year between 1000 and 2000 CE and counting the number of records for each year, we can create a graph of the works of art per year in the museum:

So far, so good. The data look much as we would expect from this museum, starting to see a lot of works starting in 1500, with a particular strength in the “golden age” of Dutch art from the late sixteenth through the seventeenth centuries, slowly tapering off through 1900.2
But what about those Iconclass notations?
Because (as I noted above) Iconclass’s hierarchical structure is built into its syntax, one can determine the broadest category of any one notation by checking the first digit of its code. Iconclass has ten top-level divisions:
- 0 – Abstract, Non-representational Art
- 1 – Religion and Magic
- 2 – Nature
- 3 – Human being, Man in general
- 4 – Society, Civilization, Culture
- 5 – Abstract Ideas and Concepts
- 6 – History
- 7 – Bible
- 8 – Literature
- 9 – Classical Mythology and Ancient History
For the Rembrandt painting above with Iconclass notation 71C217, the first digit (7) tells us that the work contains a biblical subject. By repeating my year-by-year query of the collections data, but counting only those works whose first Iconclass digit is 7, I can create a year-by-year graph of the ratio of Biblical artworks to the total number of artworks per year (seen in blue below). Because this ratio can change drastically from year to year, I calculated from this list of ratios a moving average with a 20-year window (seen in red) which helps to smooth out the graphs, illustrating longer-term trends with less “noise” than the year-by-year data alone.3

By repeating this process for each of the ten top-level Iconclass categories, we can create a stacked line graph of subject matter ratios that seems to tell an interesting story about the changing nature of northern European art history, at least as represented in the collections of the Rijksmuseum:
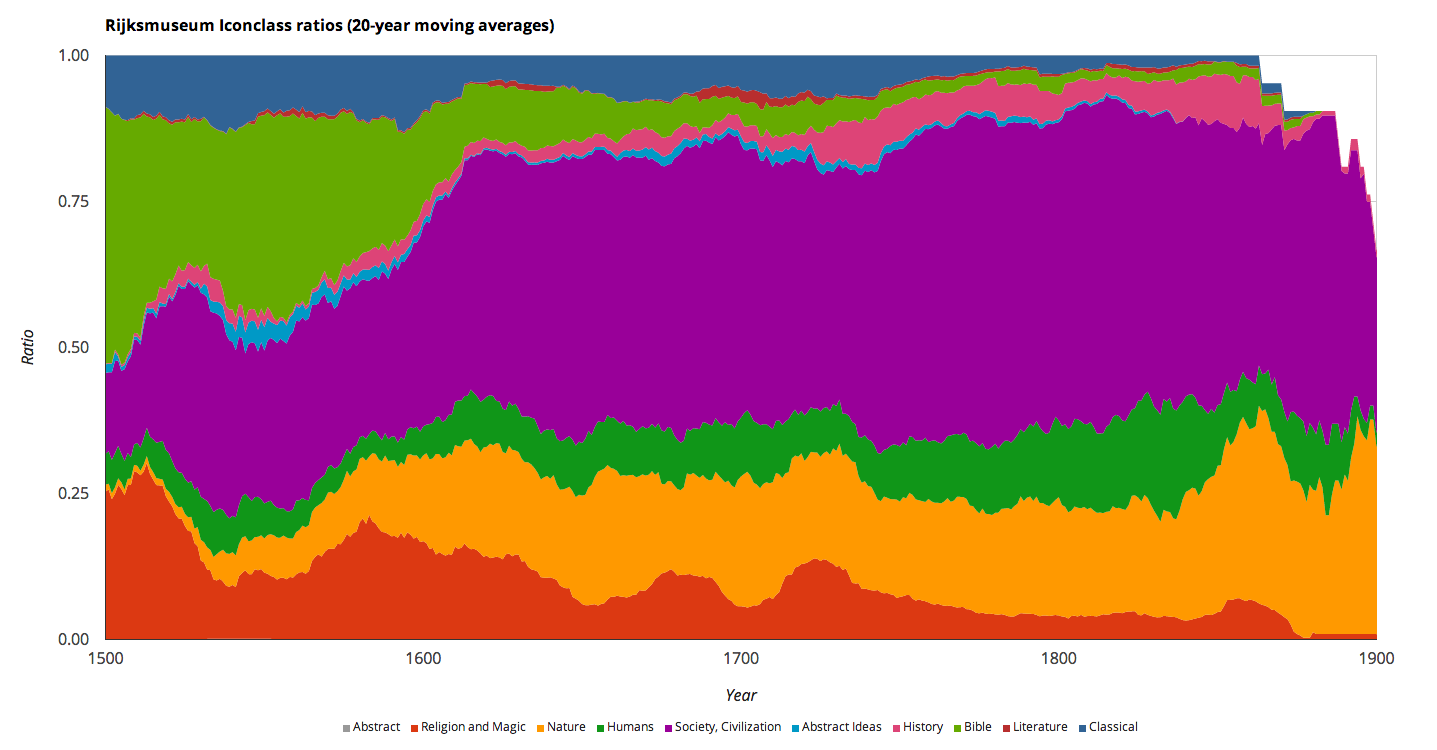
How some of these appearances may be deceiving I’ll get to in the next post, but for now, note the upheaval of subject ratios during the sixteenth century. The ratio of artworks featuring “Bible” subjects, strong at the start of the 1500s, drops sharply over the first quarter of the century to recover somewhat around 1550, only to then diminish gradually through 1600 onward. Artworks with “Religion and Magic” subjects also see a similar drop at the start of the 1500s, but their second rise comes later in the century, before joining “Bible” subjects in a mostly steady decline through the seventeenth century. What seems to fill the gap? The ratio of artworks with “Nature” or “Society, Civilization” subjects. These categories come to dominate Rijksmuseum art of the seventeenth century, and much that follows, too.
Are any early modernists nodding along now? The sharp rise in these “secular” subjects in the early decades of the seventeenth century, coupled with the decline (but not disappearance) of sacred artwork, seems to correspond to the general narrative in Dutch art history of the rise of landscapes, still-lifes, city views, and domestic scenes independent of explicit religious iconography that come in an officially-Protestant nation in which investors and merchants, rather than the Church and its religious orders, dominate the art market. The peculiar trends in that religious iconography in the sixteenth century, on the other hand, suggest at least some connection to both the surging Protestant Reformation at the start of the century, and the Catholic Counter-Reformation that coalesced fifty-odd years later.
This quick and dirty visualization masks quite a bit of the real complexities described by the Rijksmuseum data. In my next posts, I’ll dig further into these data to try and better grasp the underlying complexities of the subject trends that seem to present themselves in these sixteenth century. I’ll also be addressing the myriad problems with these data and assumptions driving my analysis; assumptions that have a lot to do not only with quantitative problems, but also with enduring art historical questions.
-
Becker, Jochen. “Review of Iconclass: An Iconographic Classification System by H. van de Waal; L. D. Couprie; R. H. Fuchs; E. Tholen.” Simiolus: Netherlands Quarterly for the History of Art 9, no. 1 (January 1, 1977): 45–47. doi:10.2307/3780424. ↩
-
Due to copyright issues, the dataset provided by the Rijksmuseum API does not include any twentieth-century artworks, though the museum itself does contain many such works. For an interesting read on copyright law and the practice of digital humanities, see Matthew Sag on non-expressive use. ↩
-
Note that this and all following charts show only the years between 1500 and 1900, the only period from which there are enough artworks in the database to yield useful information. ↩
