Charting the Rijksmuseum: Digging Deeper
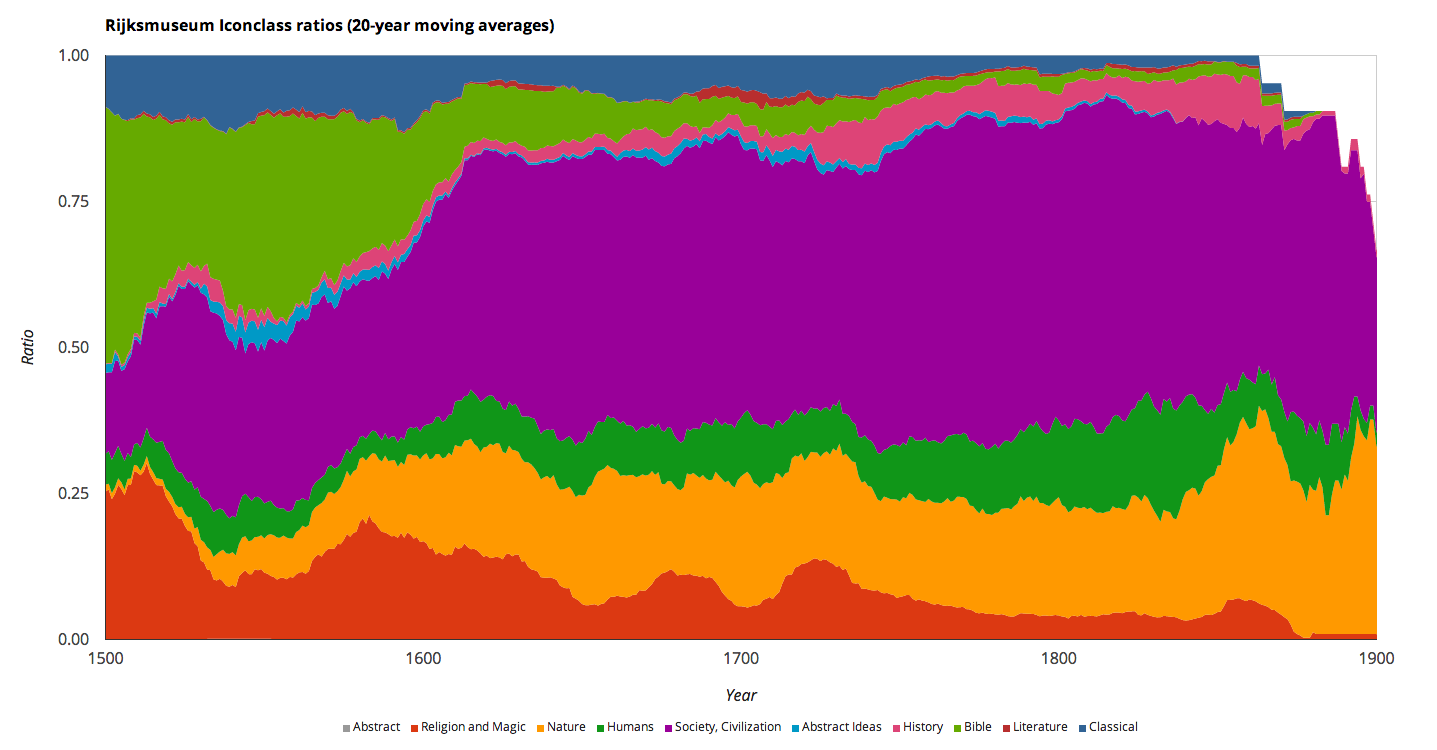
When I last left off, I was just beginning to dig into a cumulative chart of changing iconographic ratios over time in the collections of the Rijksmuseum. Before I resume, I want to address a nagging issue with that pretty rainbow graph whose ratios add up to a nice crisp %100: not all the Rijksmuseum objects have just one Iconclass code.
In fact, a lot of them have quite a few more.
So many codes, so little time
In the first iteration of my tables of Iconclass ratios, I instructed my computer to just look at the first Iconclass code assigned to each object. I knew this would leave behind some valuable data, but I was willing to do this for a first look, a kind of visual proof-of-concept that Iconclass trends were worth tracking at all, knowing that I would return with a better system for unpacking all these codes later on.
What I didn’t realize is that, of objects with usable date and subject information,1 almost half of these objects have more than one code. In fact, if you take a look at the frequency table I generated, you’ll see more than a hundred of the Rijksmuseum records have in excess of 10 distinct Iconclass notations (Here’s hoping their curatorial interns had a nice glass of Jenever later that evening). So in order to handle this, I decided to abandon making any further “stacked ratio charts”, as these could not accurately represent the reality of an artwork that occupied several different Iconclass categories at the same time. Instead, I had the computer break down each notation into its component parts, thus ensuring, for example, that a search for “Old Testament” art would pull up not just Isaac and Rebeka, but also Job and Lot and all the rest.
I also wanted to get a better sense of which more specific codes showed up with any regularity, so I created more frequency tables: one for the many “particles” of these broken-down Iconclass notations, and one for “keywords”, the terms attached to every Iconclass notation in order to help connect codes like 25F27(WHALE) swimming mammals: whale and 71V1341 Jonah is swallowed by a great fish, (sea)monster, whale, dolphin, or the like. With these frequency lists, I could get a better idea of which searches would return many artworks, and thus be useful in trying to map out subject matter trends in more detail than the top-level classifications I started with.
War and peace
This frequency list offered me a very useful path into the imposing swath of records falling under the top-level category 4 -- Society, Civilization, Culture (which appeared as an expanding wedge of purple in last week’s visualization. One of the most frequently-appearing sub-categories was 45 -- warfare; military affairs, tagged in a little over 8500 objects in the Rijksmuseum. Military conflict is one of the central factors in sixteenth- and seventeenth-century Netherlandish history, including their eighty-year war of rebellion against Spanish rule starting in the late 1500s and their disastrous conflict with France in the late 1600s. We’ve long understood that these conflicts play an important role in the story of Dutch art history – but did these wars have a quantitative effect on artistic iconography?

I was not shocked to find that the trends in artworks tagged 45 -- warfare; military affairs appears to confirm the assumption that the onset of military conflict would result in more artwork with military imagery – what surprised me was that the correlation even stronger than I had expected!
There is a sudden surge in warfare tags during the onset of iconoclasm and revolt in 1568, a small dip in such works during the 1609-1611 “Twelve-year truce” brokered with Spain after reaching a stalemate in fighting, and an even stronger drop following the 1648 Treaty of Münster that formally ended the war. The alarming spike in war imagery seen a few decades later seems to correspond to the 1672 “Rampjaar”, or disaster year, which witnessed the outbreak of war between the Netherlands and both France and England (here, the 20-year moving average I have applied to the trend line shows a misleadingly-early rise in this imagery: 40% of Rijksmuseum artworks from 1672 are tagged “warfare” compared to 3% the year earlier.) Presumably there are similar correlations to wars of the eighteenth and nineteenth centuries (if you see anything striking, please add a comment below.)
So how might war impact the depiction of other secular subjects? Another relatively frequent classification in the Rijksmuseum data is 43 -- recreation, amusement, and I hypothesized one might find an inverse correlation between the two. Would more fighting mean less interest in merry companies?

Not quite, it seems. If anything, I am intrigued by the persistence of these kinds of images at around 5% to 8% of all artworks after their sudden appearance in the first half of the sixteenth century, varying little in relation to the changes in warfare artwork. In this particular case, I generated a list of the records that make up that spike between 1500 and 1550. Quite a lot of this burst of “recreation” artwork comprises prints of both peasant and courtly dancing. I would be curious to know if this is a widespread trend in northern European art, or if it is only a fluke of the Rijksmuseum’s particular collections – some noise interfering with our signal.
One seeming-exception to the non-relation of these trends is a noticeable drop in amusement images at the same time that we see a spike in warfare images at the end of the 12 year truce in 1621. Why would the trend in amusement images be more responsive to these changes in the political situation than to the massive shift in the 1560s and 70s when the revolt broke out?
Another intriguing classification near the top of the frequency table was 46 -- social and economic life, transport and communication, a broad category that includes imagery of market scenes and trading ships.

Images of this category appear more sensitive to war and conflict, but also reflect growing Dutch prosperity around the turn of the century despite the ongoing revolt. On top of the already-growing trend in images of economic life and trade, note the uptick in social/economic life imagery at the start of the Twelve-Year Truce in 1609, a trend not stopped by the 1621 resumption of hostilities alone, but likely reinforced by the 1637 crash in tulip prices after massive speculation in the flowers’ cherished bulbs. The trend in these images is an almost perfect inversion of war imagery after the 1648 peace treaty and through the ‘Rampjaar’ after that, an event conventionally used to mark the end of the United Provinces’ social and economic Golden Age.
Embarrassment of riches?
Art historians continually connect this prosperous era to the subject matter of Dutch heroic landscapes, bustling cityscapes, and triumphal views of their naval trade dominance, not to mention bountiful still-lifes.2 Another category, 41 -- material aspects of daily life, encompasses domestic scenes as well as images of food and clothing or any other objects arrayed in still-life displays. Through this we might get some idea about the trends in still-life or domestic scenes in Dutch art.

The steady rise in the ratio of images of material aspects of daily life tracks closely with images of economic life. I also included a measure of images tagged with both of these Iconclass codes in order to demonstrate that these two trends don’t just appear correlated due to appearing in the same artworks; there genuinely appears to be a dual rise in these two kinds of images up through the first half of the seventeenth century. Intriguingly, however, even as images of public commerce and social life declined in the wake of the “Rampjaar”, still-life and domestic scenes continued their rise well through the eighteenth century unperturbed.
The mutability of topics
In each of these examples I have been actively searching for explanations for apparent trends in iconography over time. Starting from the close correlation between the onset and conclusion of historical conflicts and the changing ratios of war imagery in Dutch art, I looked through a handful of other subcategories of “Society and Civilization” as defined by Iconclass that were 1) both common enough in the collections of the Rijksmuseum that we could meaningfully visualize them, and 2) might have some relationship to military conflict.
While some of these trends seemed to respond to conflict more than others, you’ll note none of them perfectly corresponds over the five hundred years of artwork records that I checked. This is reassuring. What we are seeing is an instance of artwork genres reconfiguring over time, an issue with which scholars who develop topic models of literature must grapple. As Benjamin Schmidt, among others, has pointed out, there is no ur-list of cultural topics that remains static over centuries, with only their relative ratios changing. Though different from topic modeling driven by LDA, in which topic classifications are not preset by the researcher but generated algorithmically, Iconclass’ model of iconography operates on a similar assumption that iconographic categories are stable over time.
I’ll discuss this a bit more in my next post, but it does remind us that the use of certain iconography at one point in time may have had a rather different meaning than it does a century later. The possible relationships between different iconographic trends is particularly interesting for art historians. For example, what does our chart comparing images of economic and social life with those of material goods really have to tell us? Though these would seem to be logically connected subjects, their disjoint after the mid-1600s suggests that whatever drove images of “public” prosperity in particular (market scenes, seascapes filled with trading vessels, linen bleaching fields) may actually have been quite distinct from what drove images of “private” prosperity (still-lifes, domestic interiors), even as both certainly saw a boost from the economic growth witnessed by the Dutch Republic during its golden age.
In my next post I’ll be thinking a bit more about the difference between classifying iconography and understanding the meanings of these artworks, and I will also touch on the problems of media – specifically, why we’re probably not seeing painted iconography at all in these overall trends!
-
Tidying the Rijksmuseum data involved regularizing the values stored in each record’s
Datefield. For example, turning1631-1632into1631, orcirca 1580into1580. This cleaning process (sometimes called “munging”) is essential for the kind of quantitative inquiry I wanted to perform, however it does further abstract our data from the messy realities of the physical objects. This may be an acceptable tradeoff, but it must not go unacknowledged; indeed, a common and welcome refrain in digital humanities literature is the critical eye cast upon the methods of creating and processing cultural data. For one example of many, see Fiormonte, Domenico, Valentina Martiradonna, and Desmond Schmidt. “Digital Encoding as a Hermeneutic and Semiotic Act: The Case of Valerio Magrelli” Digital Humanities Quarterly 4, no. 1 (2010). URL ↩ -
In particular, see Simon Schama, The Embarrassment of Riches: An Interpretation of Dutch Culture in the Golden Age (New York: Knopf, 1987) and Julie Hochstrasser, Still Life and Trade in the Dutch Golden Age (New Haven: Yale University Press, 2007). ↩
